


























College Football Team Pass Rate Rankings
- 2026
- 2025
- All
- ACC
- American Athletic
- Big 12
- Big Ten
- Conference USA
- FBS Independents
- Mid-American
- Mountain West
- Pac-12
- SEC
- Sun Belt
| Team | ||
|---|---|---|
| 1 | 65.2% | |
| 2 | 62.4% | |
| 3 | 61.4% | |
| 4 | 61.2% | |
| 5 | 59.8% | |
| 6 | 57.6% | |
| 7 | 57.3% | |
| 7 | 57.3% | |
| 9 | 57.1% | |
| 10 | 56.9% | |
| 11 | 56.7% | |
| 12 | 56.6% | |
| 13 | 56.5% | |
| 14 | 56.2% | |
| 15 | 55.6% | |
| 16 | 55.4% | |
| 17 | 55.2% | |
| 18 | 55.1% | |
| 19 | 54.8% | |
| 19 | 54.8% | |
| 21 | 54.7% | |
| 22 | 54.6% | |
| 22 | 54.6% | |
| 24 | 54.5% | |
| 24 | 54.5% | |
| 26 | 54.4% | |
| 27 | 54.3% | |
| 28 | 54.2% | |
| 29 | 54.1% | |
| 29 | 54.1% | |
| 31 | 54.0% | |
| 31 | 54.0% | |
| 33 | 53.8% | |
| 34 | 53.7% | |
| 35 | 53.6% | |
| 36 | 53.5% | |
| 37 | 53.4% | |
| 38 | 53.2% | |
| 38 | 53.2% | |
| 40 | 53.1% | |
| 40 | 53.1% | |
| 42 | 52.8% | |
| 43 | 52.7% | |
| 44 | 52.6% | |
| 45 | 52.5% | |
| 46 | 52.4% | |
| 46 | 52.4% | |
| 48 | 52.0% | |
| 49 | 51.8% | |
| 49 | 51.8% | |
| 49 | 51.8% | |
| 52 | 51.7% | |
| 52 | 51.7% | |
| 54 | 51.5% | |
| 55 | 51.4% | |
| 55 | 51.4% | |
| 55 | 51.4% | |
| 58 | 51.3% | |
| 59 | 51.1% | |
| 59 | 51.1% | |
| 61 | 51.0% | |
| 62 | 50.7% | |
| 62 | 50.7% | |
| 64 | 50.6% | |
| 64 | 50.6% | |
| 66 | 50.5% | |
| 67 | 50.3% | |
| 68 | 50.0% | |
| 69 | 49.9% | |
| 70 | 49.6% | |
| 71 | 49.3% | |
| 72 | 49.2% | |
| 73 | 49.0% | |
| 73 | 49.0% | |
| 75 | 48.8% | |
| 76 | 48.7% | |
| 77 | 48.5% | |
| 77 | 48.5% | |
| 79 | 48.4% | |
| 79 | 48.4% | |
| 81 | 48.2% | |
| 81 | 48.2% | |
| 81 | 48.2% | |
| 84 | 48.1% | |
| 85 | 47.7% | |
| 85 | 47.7% | |
| 87 | 47.6% | |
| 87 | 47.6% | |
| 89 | 47.4% | |
| 89 | 47.4% | |
| 91 | 47.3% | |
| 92 | 47.1% | |
| 92 | 47.1% | |
| 92 | 47.1% | |
| 95 | 46.5% | |
| 96 | 46.2% | |
| 97 | 46.1% | |
| 97 | 46.1% | |
| 97 | 46.1% | |
| 100 | 46.0% |
Query every college football statwith your AI subscription.
The most powerful AI models now connect to statrankings+. Every FBS player and team stat, on the site or inside Claude, ChatGPT and Grok.
- ✓120+ advanced player stats and 80+ team stats, live in your chat
- ✓Every number pulled from our database, never guessed
- ✓No API keys or tech know-how

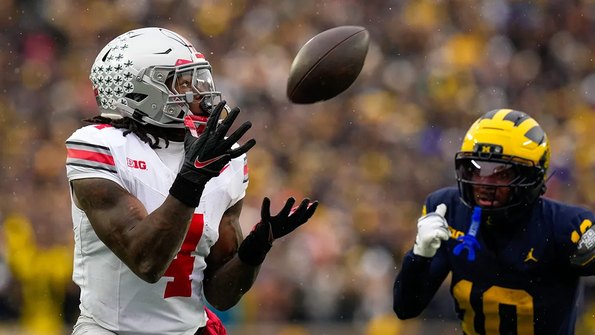
Among FBS receivers with 55+ targets, Jeremiah Smith is the most efficient at 1.04 EPA per target, 64% higher than anyone else. He also owns 53% of Ohio State's air yards.
Or start free with your email
Unlock every college football player and team stat page.
Already have an account? Sign in
Which teams have the highest pass rate in college football in 2026?
Through games played November 22, 2026, Hawai'i has the highest pass rate in college football at 65.2%. California is second at 62.4% & Oregon State third at 61.4%. Hawai'i's rate is 2.8 percentage points above second place & 10.7 percentage points above the 25th-ranked team.
Only 8.3 percentage points separate first from tenth. Washington is fourth at 61.2%, Delaware fifth at 59.8% & Arizona sixth at 57.6%. Northern Illinois & Sam Houston are tied for seventh at 57.3%. Georgia Southern is ninth at 57.1% & Florida Atlantic tenth at 56.9%.
Four separate ranks inside the top 25 are shared by more than one team. Eastern Michigan is 11th at 56.7%, Sacramento State 12th at 56.6%, TCU 13th at 56.5%, Minnesota 14th at 56.2%, Middle Tennessee 15th at 55.6%, Baylor 16th at 55.4% & Maryland 17th at 55.2%.
The last seven teams in the ranking sit inside three tenths of a percentage point. Virginia Tech is 18th at 55.1%. USC & Purdue are tied 19th at 54.8%. Colorado State is 21st at 54.7%. Stanford & Illinois are tied 22nd at 54.6% and Southern Miss & North Carolina tied 24th at 54.5%.
What is a typical pass rate for an FBS team in college football?
Through games played November 22, 2026, the median pass rate among all 138 FBS teams is 49.8%, and the middle half falls between 45.4% and 53.6%.
How this ranking is measured
The ranking above covers the top 25 of all 138 FBS teams in the 2026 regular season. No minimum play threshold is applied. Pass rate is the share of a team's plays that are pass plays, measured across the same play sample used by Pass Rate Over Expectation and Expected Pass Rate. Only FBS teams are ranked. Figures are as of November 22, 2026 & are recalculated on StatRankings after each game's play-by-play is processed.