
StatRankingsStatRankings
ESC
    Login
    StatRankingsStatRankings
    LoginUnlock+
    ESC
      Connect AIClaudeChatGPTGrok
      NFL StatsBase Player StatsBase Team Stats
      statsuite+NFL Stats Archive Advanced Player StatsAdvanced Team StatsFantasy Point MetricsFantasy Points AllowedExpected Fantasy Points (xFP)
      Premium NFL ToolscoverageIQ+wr/cb+shadowcoverage+statbuilder+redzone+
      projections+Seasonal ProjectionsWeekly Projections
      Free Hubs & ToolsSubscriber DiscordFantasy Football Rankings + ADPNFL Player Page HubNFL Depth ChartsNFL Team Game LogsOffensive Line RankingsPlayoff Schedule GridTeam Target ShareNFL Survivor MapBetting Trends ToolPrediction MarketsNFL Stat GlossaryNFL Week 8 MatchupsLIVEWR/CB, RB & QB data. 30+ advanced metrics.
      NFL StatsBase Player StatsBase Team Stats
      NFL statsuite+Advanced Player StatsAdvanced Team StatsFantasy Point MetricsFantasy Points AllowedExpected Fantasy Points (xFP)
      NFL Premium ToolscoverageIQ+wr/cb+shadowcoverage+statbuilder+redzone+
      All NBA StatsBase Player StatsBase Team Stats
      NBA projections+Daily Projections
      NFL projections+Seasonal ProjectionsWeekly Projections
      All CFB StatsPlayer StatsTeam Stats
      CFB Advanced StatsAll Advanced StatsAdvanced Player StatsAdvanced Team Stats
      Free Hubs & ToolsFantasy Football Rankings + ADPNFL Player Page HubNBA Player Page HubNFL Depth ChartsNFL Team Game LogsOffensive Line RankingsPlayoff Schedule GridTeam Target ShareNFL Week 8 MatchupsLIVEWR/CB, RB & QB data. 30+ advanced metrics.
      Find a Lineoddsboard+predictionmarkets+
      Betting Trends ToolMoneylineAgainst the SpreadOver/Under
      ProjectionsNFL Weekly ProjectionsNBA Daily Projections
      Survivor PoolsNFL Survivor MapNFL Week 8 MatchupsLIVEWR/CB, RB & QB data. 30+ advanced metrics.
      All CFB StatsPlayer StatsTeam Stats
      Advanced StatsAll Advanced StatsAdvanced Player StatsAdvanced Team Stats
      Free Hubs & ToolsPrediction MarketsCFB Stat Glossary
      All NBA StatsBase Player StatsBase Team Stats
      projections+Daily Projections
      Free Hubs & ToolsNBA Player Page HubPrediction MarketsNBA Stat Glossary
      ESC
        ClaudeChatGPTGrok
        Connect to AI

        A PDF connection guide arrives after purchase.
        Already subscribed? Email us.

        NFL StatsBase Player StatsBase Team Stats
        statsuite+Advanced Player StatsAdvanced Team StatsFantasy Point MetricsFantasy Points AllowedExpected Fantasy Points (xFP)
        Premium NFL ToolscoverageIQ+wr/cb+shadowcoverage+statbuilder+redzone+
        projections+Seasonal ProjectionsWeekly Projections
        Free Hubs & ToolsFantasy Football Rankings + ADPNFL Player Page HubNFL Depth ChartsNFL Team Game LogsOffensive Line RankingsPlayoff Schedule GridTeam Target ShareNFL Survivor MapBetting Trends ToolPrediction MarketsNFL Stat Glossary
        NFL Stats ArchiveEvery stat, downloadable. Subscriber DiscordConnect to our subscriber-only Discord.NFL Week 8 MatchupsLIVEWR/CB, RB & QB data. 30+ advanced metrics.
        All CFB StatsPlayer StatsTeam Stats
        Advanced StatsAll Advanced StatsAdvanced Player StatsAdvanced Team Stats
        Free Hubs & ToolsPrediction MarketsCFB Stat Glossary
        All NBA StatsBase Player StatsBase Team Stats
        projections+Daily Projections
        Free Hubs & ToolsNBA Player Page HubPrediction MarketsNBA Stat Glossary
        NFL StatsBase Player StatsBase Team Stats
        NFL statsuite+Advanced Player StatsAdvanced Team StatsFantasy Point MetricsFantasy Points AllowedExpected Fantasy Points (xFP)
        NFL Premium ToolscoverageIQ+wr/cb+shadowcoverage+statbuilder+redzone+
        All NBA StatsBase Player StatsBase Team Stats
        NBA projections+Daily Projections
        NFL projections+Seasonal ProjectionsWeekly Projections
        All CFB StatsPlayer StatsTeam Stats
        CFB Advanced StatsAll Advanced StatsAdvanced Player StatsAdvanced Team Stats
        Free Hubs & ToolsFantasy Football Rankings + ADPNFL Player Page HubNBA Player Page HubNFL Depth ChartsNFL Team Game LogsOffensive Line RankingsPlayoff Schedule GridTeam Target Share
        NFL Week 8 MatchupsLIVEWR/CB, RB & QB data. 30+ advanced metrics.
        Find a Lineoddsboard+predictionmarkets+
        Betting Trends ToolMoneylineAgainst the SpreadOver/Under
        ProjectionsNFL Weekly ProjectionsNBA Daily Projections
        Survivor PoolsNFL Survivor Map
        NFL Week 8 MatchupsLIVEWR/CB, RB & QB data. 30+ advanced metrics.
        StatRankings - Sports StatisticsStatRankings - Sports Statistics
        NFL Stats
        Base Player StatsBase Team Stats
        StatSuite+
        Advanced Player StatsAdvanced Team Stats
        Projections+
        Seasonal ProjectionsWeekly Projections
        NFL Stats ArchiveEvery stat, downloadable.
        Premium Tools
        coverageIQ+wr/cb+shadowcoverage+statbuilder+redzone+
        Free Hubs & Tools
        FantasyFootballRankings+Betting Trends ToolNFL Player Page HubNFL Depth ChartsNFL Team Game LogsOffensive Line RankingsNFL Survivor MapTeam Target ShareTarget Share AllowedNFL Stat Glossary
        NFL Week 8 MatchupsLIVEWR/CB, RB & QB data. 30+ advanced metrics.
        All CFB Stats
        Player StatsTeam Stats
        Advanced Stats
        Advanced Player StatsAdvanced Team Stats
        Free Hubs & Tools
        CFB Stat Glossary
        All NBA Stats
        Base Player StatsBase Team Stats
        NBA Player Page Hub
        Free Hubs & Tools
        NBA Stat Glossary
        Projections+
        Daily Projections
        NFL Stats
        Base Player StatsBase Team Stats
        NFL StatSuite+
        Advanced Player StatsAdvanced Team StatsFantasy Point MetricsFantasy Points AllowedExpected Fantasy Points (xFP)
        NFL Projections+
        Seasonal ProjectionsWeekly Projections
        All NBA Stats
        Base Player StatsBase Team Stats
        NBA Projections+
        Daily Projections
        Premium Tools
        coverageIQ+wr/cb+shadowcoverage+statbuilder+redzone+
        Free Hubs & Tools
        FantasyFootballRankings+NFL Player Page HubNBA Player Page HubNFL Depth ChartsNFL Team Game LogsOffensive Line RankingsPlayoff Schedule GridTeam Target ShareTarget Share Allowed
        NFL Week 8 MatchupsLIVEWR/CB, RB & QB data. 30+ advanced metrics.
        Find a Line
        oddsboard+predictionmarkets+
        Betting Trends Tool
        MoneylineAgainst the SpreadOver/Under
        Projections
        NFL Weekly ProjectionsNBA Daily Projections
        Survivor Pools
        NFL Survivor Map
        NFL Week 8 MatchupsLIVEWR/CB, RB & QB data. 30+ advanced metrics.
        Connect AIClaudeChatGPTGrok
        ESC
          LoginUnlockstatrankings+

            Team Stats

            Eff. Poss Ratio
            Extra Scoring Chances
            Games Played
            Opp Eff. Poss Ratio
            Poss per Game
            % Points from 2-Pt FG
            % Points from 3-Pt FG
            % Points from FT
            Average Biggest Lead
            Average Scoring Margin
            Bench Points per Game
            Defensive Efficiency
            Fastbreak Efficiency
            Fastbreak Points per Game
            First Half Points per Game
            First Half Scoring Margin
            First Qtr Scoring Margin
            Floor %
            Fourth Qtr Scoring Margin
            Margin Thru 3rd Qtr
            Offensive Efficiency
            Opp Bench Pts/Game
            Points from 2-Pt FG
            Points from 3-Pt FG
            Points in Paint/Game
            Points per Qtr
            Second Chance Pts/Game
            Second Half Scoring Margin
            Second Qtr Scoring Margin
            Third Qtr Scoring Margin
            Defensive Rebound %
            Defensive Rebounds per Game
            Offensive Rebound %
            Offensive Rebounds per Game
            Total Rebound %
            Total Rebounds per Game
            Effective FG %
            FG %
            FG Attempts per Game
            FG Made per Game
            FTA per FGA
            FTM per 100 Poss
            Free Throw %
            Free Throw Attempts per Game
            Free Throws Attempted per Offensive Play
            Free Throws Made per Game
            Non-blocked 2P%
            Three-Point %
            Three-Point Attempts per Game
            Three-Point Rate
            Three-Pointers Made per Game
            True Shooting %
            Two-Point %
            Two-Point Rate
            Block %
            Blocks per Game
            Steals per Defensive Play
            Steals per Game
            Assist-to-Turnover Ratio
            Assists per FG Made
            Assists per Game
            Assists per Offensive Play
            Turnover %
            Turnovers per Game
            Turnovers per Offensive Play
            Opp 2P Rate
            Opp 2P%
            Opp 3P Rate
            Opp 3P%
            Opp 3PA per Game
            Opp 3PM per Game
            Opp FG%
            Opp FGA per Game
            Opp FGM per Game
            Opp FT%
            Opp FTA per FGA
            Opp FTA per Game
            Opp FTM per 100 Poss
            Opp FTM per Game
            Opp Fastbreak Pts per Game
            Opp Non-blocked 2P%
            Opp Points in Paint per Game
            Opp TS%
            Opp eFG%
            Turnovers Forced per Game
            Personal Fouls per Game
            Personal Fouls per Poss
            Opp Defensive Rebound %
            Opp Defensive Rebounds per Game
            Opp Offensive Rebound %
            Opp Offensive Rebounds per Game
            Opp Second Chance Pts/Game
            Opp Total Rebounds per Game

            Defensive Efficiency | NBA Team Stats

            1. NBA>
            2. Teams>
            3. Scoring>
            4. Defensive Efficiency
            Defensive Efficiency measures how many points a team allows per 100 possessions. Last updated 10/31/26
            • Effective Possession Ratio
            • Extra Scoring Chances per Game
            • Games Played
            • Opponent Effective Possession Ratio
            • Possessions per Game
            • Percentage of Points from 2-Point Field Goals
            • Percentage of Points from 3-Point Field Goals
            • Percentage of Points from Free Throws
            • Average Biggest Lead
            • Average Scoring Margin
            • Bench Points per Game
            • Defensive Efficiency
            • Fastbreak Efficiency
            • Fastbreak Points per Game
            • First Half Points per Game
            • First Half Scoring Margin
            • First Quarter Scoring Margin
            • Floor Percentage
            • Fourth Quarter Scoring Margin
            • Margin Through Third Quarter
            • Offensive Efficiency
            • Opponent Bench Points per Game
            • Points from 2-Point Field Goals
            • Points from 3-Point Field Goals
            • Points in the Paint per Game
            • Points per Quarter
            • Second Chance Points per Game
            • Second Half Scoring Margin
            • Second Quarter Scoring Margin
            • Third Quarter Scoring Margin
            • Defensive Rebound Percentage
            • Defensive Rebounds per Game
            • Offensive Rebound Percentage
            • Offensive Rebounds per Game
            • Total Rebounding Percentage
            • Total Rebounds per Game
            • Effective Field Goal Percentage
            • Field Goal Percentage
            • Field Goal Attempts per Game
            • Field Goals Made per Game
            • Free Throw Attempts per Field Goal Attempt
            • Free Throws Made per 100 Possessions
            • Free Throw Percentage
            • Free Throw Attempts per Game
            • Free Throws Attempted per Offensive Play
            • Free Throws Made per Game
            • Non-Blocked Two-Point Percentage
            • Three-Point Percentage
            • Three-Point Attempts per Game
            • Three-Point Rate
            • Three-Pointers Made per Game
            • True Shooting Percentage
            • Two-Point Percentage
            • Two-Point Rate
            • Block Percentage
            • Blocks per Game
            • Steals per Defensive Play
            • Steals per Game
            • Assist-to-Turnover Ratio
            • Assists per Field Goal Made
            • Assists per Game
            • Assists per Offensive Play
            • Turnover Percentage
            • Turnovers per Game
            • Turnovers per Offensive Play
            • Opponent Two-Point Rate
            • Opponent Two-Point Percentage
            • Opponent Three-Point Rate
            • Opponent Three-Point Percentage
            • Opponent Three-Point Attempts per Game
            • Opponent Three-Pointers Made per Game
            • Opponent Field Goal Percentage
            • Opponent Field Goal Attempts per Game
            • Opponent Field Goals Made per Game
            • Opponent Free Throw Percentage
            • Opponent FTA per FGA
            • Opponent Free Throw Attempts per Game
            • Opponent FTM per 100 Possessions
            • Opponent Free Throws Made per Game
            • Opponent Fastbreak Points per Game
            • Opponent Non-Blocked Two-Point Percentage
            • Opponent Points in Paint per Game
            • Opponent True Shooting Percentage
            • Opponent Effective Field Goal Percentage
            • Turnovers Forced per Game
            • Personal Fouls per Game
            • Personal Fouls per Possession
            • Opponent Defensive Rebound Percentage
            • Opponent Defensive Rebounds per Game
            • Opponent Offensive Rebound Percentage
            • Opponent Offensive Rebounds per Game
            • Opponent Second Chance Points per Game
            • Opponent Total Rebounds per Game
            • '26 Playoffs
            • 2026
            • '25 Playoffs
            • 2025
            • '24 Playoffs
            • 2024
            • '23 Playoffs
            • 2023
            • '22 Playoffs
            • 2022
            • '21 Playoffs
            • 2021
            • '20 Playoffs
            • 2020
            • '19 Playoffs
            • 2019
            • '18 Playoffs
            • 2018
            Couldn't update, showing the last loaded results
            Team
            1Detroit Pistons101.291.899.698.7-104.999.5107.6
            2Philadelphia 76ers102.1102.0104.9103.7-103.599.4112.6
            2Minnesota Timberwolves102.1100.3108.9102.7-101.2103.0111.0
            4Toronto Raptors103.0133.3114.0103.0-101.9104.6111.1
            5Oklahoma City Thunder103.4123.0110.1103.4-99.2109.5105.7
            6Memphis Grizzlies104.497.7103.5104.4-100.5105.4116.5
            7Houston Rockets107.2118.5106.2107.4-104.4108.6110.9
            8Washington Wizards107.380.4106.0106.5-99.1115.7120.3
            8Boston Celtics107.3105.1103.4107.3-104.8117.4110.4
            10San Antonio Spurs107.6103.4104.0107.6-110.2103.9109.4
            11Charlotte Hornets108.1101.7105.4109.6-112.8103.1112.6
            12New York Knicks108.2107.6108.9109.7-103.4113.2110.8
            13Dallas Mavericks108.9108.3102.7104.6-107.6110.2114.7
            14Atlanta Hawks110.2111.3115.4110.1-117.2103.3111.9
            15Los Angeles Lakers110.9116.1112.6112.9-113.7108.0114.0
            15LA Clippers110.9127.2113.5110.9-100.1117.9113.7
            17Cleveland Cavaliers111.0115.2114.7111.0-113.0108.0112.9
            18Portland Trail Blazers111.5121.2119.3--104.3118.3112.5
            19Denver Nuggets112.3121.4115.1112.3-125.4102.8115.3
            20Brooklyn Nets112.8104.4115.0112.8-113.2112.4117.2
            21New Orleans Pelicans113.1104.5111.2113.1-107.8121.0116.5
            22Orlando Magic113.7121.8112.5113.7-115.4112.5112.0
            23Golden State Warriors114.298.4107.5111.9-103.4119.5113.5
            24Utah Jazz115.6110.1115.6115.6-114.8119.0120.0
            25Indiana Pacers115.9139.3120.2116.2-114.8116.4116.5
            25Miami Heat115.9122.7113.3114.8-119.0109.9112.4
            27Milwaukee Bucks116.6130.1113.8116.6-115.6118.1117.4
            28Chicago Bulls118.1119.5120.6117.6-117.8118.2115.8
            29Sacramento Kings121.0115.7121.3121.0-121.8120.4118.7
            30Phoenix Suns122.4128.0123.0--123.7121.1111.6
            INCLUDED WITH statrankings+

            Query every NBA statwith your AI subscription.

            xClaudeClaudexChatGPTChatGPTxGrokGrok

            The most powerful AI models now connect to statrankings+. Every NBA player and team stat, on the site or inside Claude, ChatGPT and Grok.

            • ✓Advanced player stats and team stats, live in your chat
            • ✓Every number pulled from our database, never guessed
            • ✓No API keys or tech know-how
            Connect your AI →
            ChatGPT·statrankings+connected
            Who are the top three in player efficiency rating?
            statrankings+

            Victor Wembanyama led the NBA with a 31.7 PER, 0.2 ahead of Giannis Antetokounmpo. Nikola Jokic was third at 30.6.

            #PLAYERPOSPER
            1V. WembanyamaSASF-C31.7
            2G. AntetokounmpoMILF31.5
            3N. JokicDENC30.6
            4S. Gilgeous-AlexanderOKCG29.7
            Ask ChatGPT↑
            JUST ASK
            Who made the most threes last season?Charlotte HornetsCHALaMelo Ball · 277Which rookie hit the most threes?Charlotte HornetsCHAKon Knueppel · 274Who led the NBA in scoring?Los Angeles LakersLALLuka Doncic · 33.5 PPGWho averaged the most assists?Denver NuggetsDENNikola Jokic · 10.7Which defense allowed the lowest true shooting %?Oklahoma City ThunderOKCThunder · 55.0%Who are the top three in player efficiency rating?San Antonio SpursSASVictor Wembanyama · 31.7 PERWho made the most threes last season?Charlotte HornetsCHALaMelo Ball · 277Which rookie hit the most threes?Charlotte HornetsCHAKon Knueppel · 274Who led the NBA in scoring?Los Angeles LakersLALLuka Doncic · 33.5 PPGWho averaged the most assists?Denver NuggetsDENNikola Jokic · 10.7Which defense allowed the lowest true shooting %?Oklahoma City ThunderOKCThunder · 55.0%Who are the top three in player efficiency rating?San Antonio SpursSASVictor Wembanyama · 31.7 PER

            Or start free with your email

            Unlock every NBA player and team stat page.

            Already have an account? Sign in

            What is Defensive Efficiency?

            Defensive Efficiency measures how many points a team allows per 100 possessions. A lower defensive efficiency indicates a stronger defense. For example, a team with a defensive efficiency of 105 allows 105 points per 100 opponent possessions.

            Which teams have the lowest defensive efficiency in the NBA in 2026?

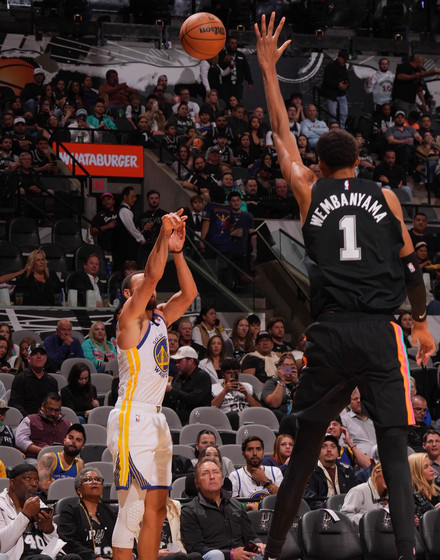
            Through games played October 30, 2026, Detroit has the lowest defensive efficiency in the NBA at 101.2. Philadelphia & Minnesota are tied for second at 102.1. A gap of 0.9 points separates Detroit from second place, & 14.7 points separate it from the 25th-ranked team.

            Only 6.4 points separate first from tenth. Toronto is fourth at 103.0, Oklahoma City fifth at 103.4, Memphis sixth at 104.4 & Houston seventh at 107.2. Washington & Boston are tied for eighth at 107.3. San Antonio is tenth at 107.6.

            Three separate ranks inside the top 25 are shared by more than one team. Charlotte is 11th at 108.1, New York 12th at 108.2, Dallas 13th at 108.9 & Atlanta 14th at 110.2. The Los Angeles Lakers & the LA Clippers are tied 15th at 110.9. Cleveland is 17th at 111.0.

            Eight teams sit inside 2.8 points of each other from 15th to 22nd, the tightest stretch of the ranking. Portland is 18th at 111.5, Denver 19th at 112.3, Brooklyn 20th at 112.8, New Orleans 21st at 113.1, Orlando 22nd at 113.7, Golden State 23rd at 114.2, Utah 24th at 115.6 & Indiana 25th at 115.9.

            How this ranking is measured

            The ranking above covers the top 25 of 30 NBA teams in the 2026 regular season, ranked lowest first. Defensive Efficiency measures how many points a team allows per 100 possessions. Figures are as of October 30, 2026 & are recalculated on StatRankings after each game's play-by-play is processed.

            StatRankingsStatRankings

            Advanced sports data platform powered by comprehensive NFL statistics and best-in-class partner networks.

            Privacy PolicyTerms of ServicePricingRefund PolicyMethodologyGlossaryContact

            NFL STATS & DATA

            Player Stats

            Search 600+ base stats dating back to 2000

            Team Stats

            Comprehensive team analytics and performance metrics

            Advanced Stats

            Access 650+ advanced metrics since 2020

            Historical Data

            Two decades of NFL statistical trends and patterns

            Trends Hub

            Performance analysis across multiple betting markets

            NFL Depth Charts

            Starters, backups, and depth by position for every NFL team

            NFL Team Game Logs

            Weekly game logs, snap counts and usage by team.

            NFL Stat Glossary

            Definitions for every NFL stat we publish

            PROJECTIONS & RANKINGS

            NFL Player Projections

            Fantasy and prop bet insights for optimal decisions

            NFL Rankings

            Team and player rankings across all positions

            Fantasy Tools

            Advanced player analysis for fantasy football success

            Offensive Line Rankings

            All 32 NFL offensive line units ranked for the season

            BETTING INSIGHTS

            Live NFL Odds

            Moneylines from every book we track, best price per side highlighted

            NFL Week 8 Matchups

            Lines, totals and ARBY RB matchup grades for every game this week

            ATS Trends

            Against the spread performance and betting patterns

            Totals Analysis

            Over under insights and scoring trend analysis

            Moneyline Trends

            Straight up betting patterns and value identification

            Betting Splits

            Performance analysis across 35+ situational factors

            Player Props

            Individual player betting market analysis and trends

            Fantasy insights

            Fantasy Points Against

            Fantasy points against data showing defensive performance and scoring trends.

            DraftKings FPPG

            DraftKings fantasy points allowed data to help you track defensive matchups.

            FanDuel FPPG

            FanDuel fantasy points allowed data showing defensive scoring trends.

            PPR

            Full PPR fantasy points allowed data highlighting defensive matchups.

            NBA Stats & Data

            NBA Stats

            Comprehensive team analytics and performance metrics

            NBA Team Stats

            Team rankings and pace metrics

            NBA Player Stats

            Search player statistics and performance data

            NBA Stat Glossary

            Definitions for every NBA stat we publish

            © 2026 StatRankings. All Rights Reserved.